Interpret the result
What the number means
A low standard deviation points to similar values. A high standard deviation shows more variation from the mean.
Use the Standard Deviation Calculator with Steps | Sample & Population to calculate standard deviation, variance, mean, range, and view every step in a clear calculation table.
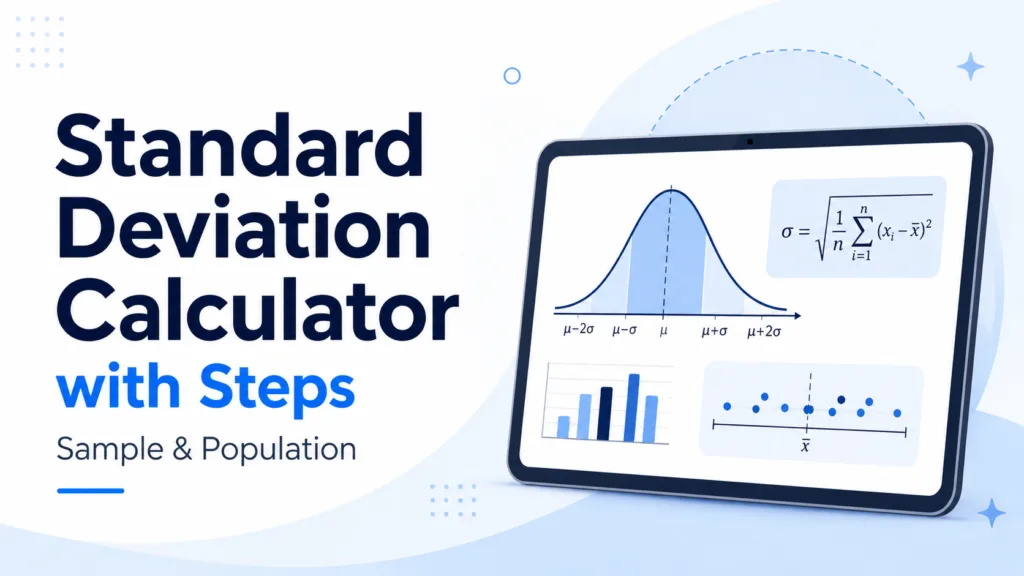
Standard deviation tells you how tightly a group of numbers sits around its average. A smaller result usually means the values are fairly consistent. A larger result means they are spread across a wider range. This calculator keeps the practical part first: enter your numbers, choose sample or population, and get the answer.
The result panel also shows the mean, variance, range, standard error, and a row-by-row calculation table. That makes it useful for homework checks, test scores, sales figures, research data, and finance examples.
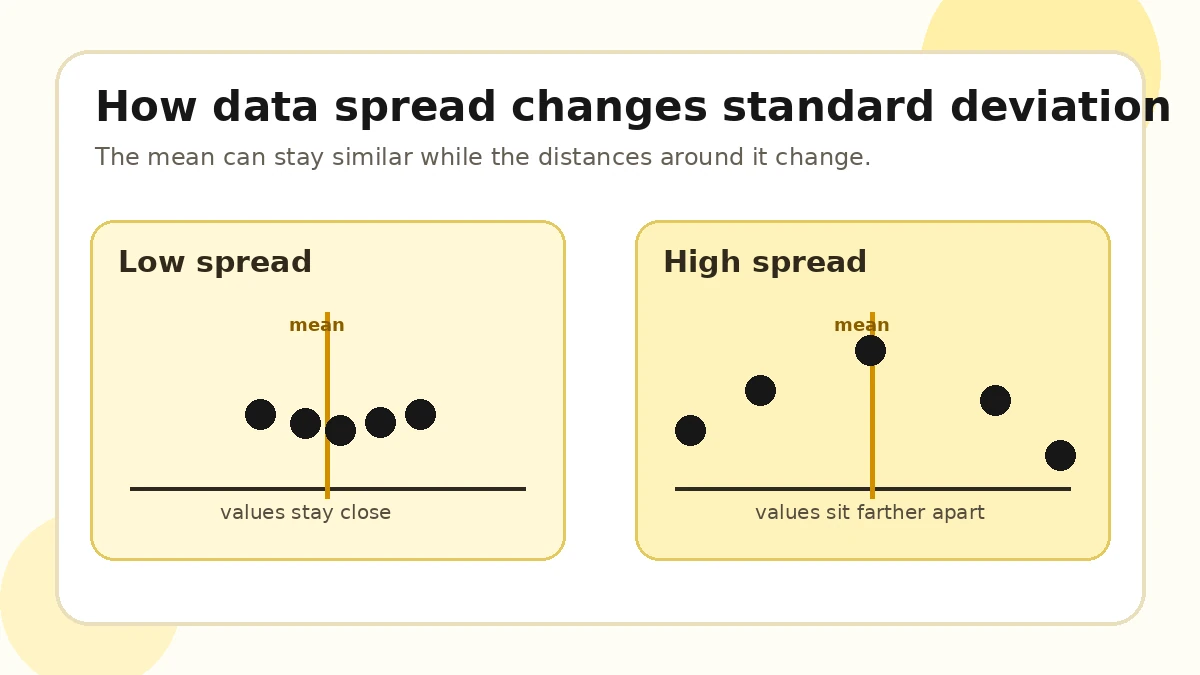
A low standard deviation points to similar values. A high standard deviation shows more variation from the mean.
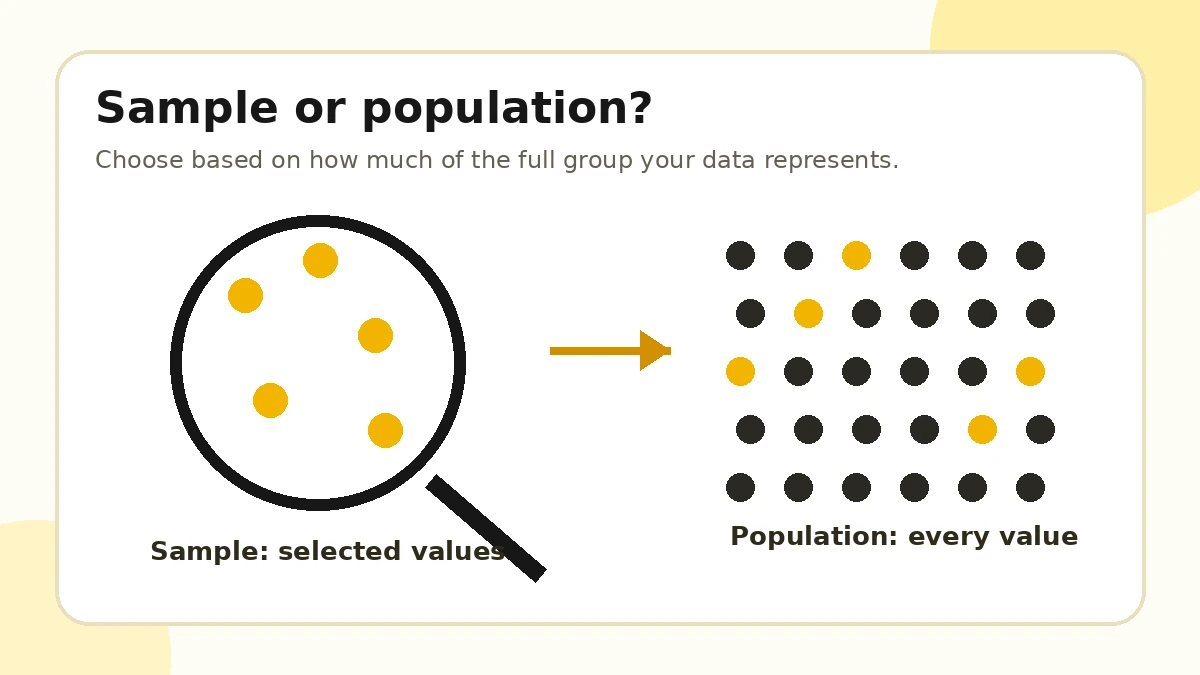
Choose sample when your numbers represent part of a larger group. Choose population when you have every value.
Use the copy buttons when you need to move the final answer or the worked solution into your notes. The calculator does not send your numbers to a server; the calculation runs in your browser.
Use sample standard deviation when the values are only a selection from a bigger group. A survey of 100 customers, a few months of market returns, or one classroom from a school are common examples.
Use population standard deviation when your list includes the entire group you want to study, such as every monthly sales figure in a completed year or every score from one finished test.
In these formulas, xᵢ is each value, μ is the population mean, x̄ is the sample mean, n is the number of values, and Σ means to add the listed values.
Data: 12, 15, 18, 21, 24
The two answers differ because the sample calculation divides by n − 1, while the population calculation divides by n.
A high result means the values are spread farther from the mean and show more variation.
A low result means most values sit fairly close to the mean.
No. Standard deviation is the square root of variance, so it is expressed in the original unit of the data.
Yes. Any numeric list can be used, including scores, prices, returns, sales, expenses, measurements, and survey results.
Yes. It displays the mean, differences from the mean, squared differences, variance, and the final square root step.